
December sales were 58, a 1.7 percent decrease year-over-year. Inventory fell significantly, down 38 percent year-over-year. With 52 new listings, the sales to-new-listings ratio dropped to 112 percent as inventory levels continued a downward trend. Months of supply jumped to 1.64 in December but is down 37% year over year. Year-over-year average prices have decreased by 2.8 percent. Prices are up across property types year-to-date and year over year, but flat for detached y/y.
Author: Steven
First Quarter 2023 Medicine Hat Market Update
Thanks mostly to a pullback in detached activity, first quarter sales did ease off the high levels reported over the past two years. However, sales levels are still consistent with long-term trends for the city and are stronger than activity reported prior to the pandemic. At the same time, new listings continued to ease this year, keeping March inventory levels amongst the lowest levels reported. Inventory has also shifted within the detached market as inventory levels continue to fall for homes priced below $300,000. With a month of supply of two months and a sales to new listings ratio of 76 per cent, conditions remain relatively tight compared to long term trends for the city. Despite the tighter conditions, total year-to-date residential average prices have eased by nearly three per cent compared to last year. Like other parts of the province, conditions remain tight for lower priced product, while higher priced homes are seeing higher levels of supply relative to sales.
Medicine Hat Real Estate Market Trends January 2023
January sales remained relatively consistent with the levels seen last year and long-term trends for January. At the same time, new listings eased slightly ensuring that inventory levels fell. The 201 units in inventory reflect the lowest January levels seen in this market since 2002. This also did little to change the currently tight market conditions as the months of supply remained relatively low at just over three months. City wide prices did ease slightly over last year, but some of that could be related to the shifts in the semi-detached side of the market. Nonetheless, detached home prices did continue to rise over levels seen in the market last year.
Medicine Hat Real Estate Update 2022
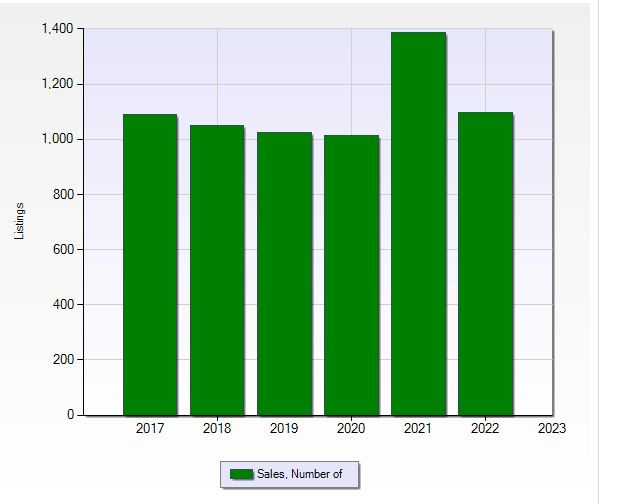
The number of single-family residential sales in Medicine Hat increased significantly between 2020 and 2021. So far in 2002 there have been 1,123 sales of detached homes which by years end maybe close to the 1,387 sales in 2021. Alberta overall sales are down 22% year-over-year (reported September 2022). Average sale prices for single family homes in Medicine hat so far in 2022 has been $312,493 which is an increase from the average of $303,632 in 2021.
Real Estate Update Medicine Hat
The number of homes sold via the MLS® System of the Medicine Hat Real Estate Board totaled 72 units in March 2020. This was down 21.7% from March 2019.On a year-to-date basis, home sales totaled 210 units over the first three months of the year, a 7.9% decline from the same period in 2019.
Residential sales activity in all of Alberta, by comparison, was down 8.5% in March 2020 compared to March 2019.

"As was expected, home sales and new listings fell back in March 2020 as both buyers and sellers moved off to the sidelines amid the economic turmoil and physical distancing guidelines associated with the coronavirus pandemic,” said Dione Todd, President of the Medicine Hat Real Estate Board. “This is likely to remain the case until those measure start to be lifted and the economy opens back up.”

The average price of homes sold in March 2020 was $298,874, rising 9.3% from March 2019.The more comprehensive year-to-date average price was $281,763, also up 9.3% from the first three months of 2019.The provincial average price for homes sold in March 2020 was $371,022, edging down 2.6% from March 2019.

Note: The Association cautions that the average MLS® residential price is a useful figure only for establishing trends and comparisons over a period of time. It does not indicate an actual price for a home due to the wide selection of housing available in the area.

There were 159 new residential listings in March 2020. This was down 27.1% on a year-over-year basis.Active residential listings numbered 639 units at the end of March, an increase of 19% from the end of March 2019. Active listings haven't been this high in the month of March in more than five years.

Months of inventory numbered 8.9 at the end of March 2020, up from the 5.8 months recorded at the end of March 2019 and above the 10-year average of 5.4 months for this time of year. The number of months of inventory is the number of months it would take to sell current inventories at the current rate of sales activity.

The combined dollar value of all home sales in March 2020 was $21.5 million, decreasing by 14.5% from the same month in 2019.The dollar value of all home sales in Alberta, by comparison, declined 10.9% compared to March 2019.Sales of all property types numbered 78 units in March 2020, down 20.4%from March 2019. The total value of all properties sold was $24.5 million, decreasing by 13.8% from March 2019.
November 2019 Update (continued)
Active residential listings numbered 659 units at the end of November, an increase of 14.4% from the end of November 2018 and the highest level for this time of the year since 2011. Months of inventory numbered 8.8 at the end of November 2019, up from the 6.4 months recorded at the end of November 2018 and above the 10-year average of 6.6 months for this time of year. The number of months of inventory is the number of months it would take to sell current inventories at the current rate of sales activity. The combined dollar value of all home sales in November 2019 was $21.5 million, decreasing by 18.7% from the same month in 2018.The dollar value of all home sales in Alberta, by comparison, was down 4.5% compared to November 2018. Sales of all property types numbered 80 units in November 2019, a decrease of 16.7% from November 2018. The total value of all properties sold was $23.8 million, down 18.3% from November 2018.
Note: The Association cautions that the average MLS® residential price is a useful figure only for establishing trends and comparisons over a period of time. It does not indicate an actual price for a home due to the wide selection of housing available in the area.
November 2019 Real Estate Medicine Hat
Medicine Hat home sales down year-over-year in November. Residential sales activity in all of Alberta, by comparison, fell 3.3% in November 2019 compared to November 2018. The average price of homes sold in November 2019 was $287,011, edging down 2.4% from November 2018.The more comprehensive year-to-date average price was $280,035, up 0.8% from the first 11 months of 2018. The provincial average price for homes sold in November 2019 was $370,440, edging down 1.2% from November 2018.
Note: The Association cautions that the average MLS® residential price is a useful figure only for establishing trends and comparisons over a period of time. It does not indicate an actual price for a home due to the wide selection of housing available in the area.
Real Estate Update July 2018
Residential sales activity reported through the MLS® Systems of real estate boards in Alberta numbered 6,001 units in June 2018. This was down 6.3% from June 2017. On a year-to-date basis, home sales totalled 27,837 units over the first six months of the year. This was down 7.9% from the same period in 2017. Nationally, home sales activity was down 10.7% from year-ago levels in June 2018. The provincial average price of homes sold in June 2018 was $402,354, edging down 2.3% from June 2017. The more comprehensive year-to-date average price was $393,281, down 2.9% from the first six months of 2017. The national average price, by comparison, fell 1.3% on a year-over-year basis to $495,797 in June 2018. Across
Alberta, monthly residential average prices were up from year-ago levels in Fort McMurray (+8.2%), Grande Prairie (+5.3%), and Medicine Hat (+2.2%). By contrast, average prices declined in Calgary (-0.6%), South Central Alberta (-0.7%), Lethbridge (-1.9%), Edmonton (-3.3%), Central Alberta (-5.2%), Alberta West (-7.0%) and Lloydminster (-7.9%). There were 12,728 new residential listings on the MLS® Systems of real estate boards in Alberta in June 2018. This was up just 1.8% on a year-over-year basis. Active residential listings numbered 39,310 units at the end of June. This was an increase of 16.9% from the end of June 2017 and marked a record for this time of the year. Months of inventory numbered 6.6 at the end of June 2018, up from the 5.2 months recorded at the end of June 2017 and above the 10-year average of 4.8 months for this time of year. The number of months of inventory is the number of months it would take to sell current inventories at the current rate of sales activity.
The dollar value of all home sales in the province in June 2018 was $2.4 billion, down 8.5% from the same month in 2017. The dollar volume of all home sales in Canada fell 11.8% on a year-over-year basis. Sales of all property types in Alberta numbered 6,324 units in June 2018; this was down 5.8% from June 2017. The total value of all properties sold was $2.6 billion, down 6.6% from June 2017.
There were 2,383 home sales recorded through the MLS® System of the Calgary Real Estate Board in June 2018, down 10.4% from a year earlier. The combined value of home sales activity in Calgary was $1.1 billion, down 10.9% from year-ago levels. There were 2,148 home sales recorded through the MLS® System of the REALTORS® Association of Edmonton in June 2018, down 7.3% from June 2017. The total value of home sales in Edmonton was $813.2 million in June 2018, down 10.3% on a year-over-year basis.
Report Farmland Value Increases 2017
The average value of Alberta farmland increased 7.3% in 2017, following average gains of 9.5% in 2016 and 11.6% in 2015. Values were driven by both demand and weather. While the province experienced steady demand in all regions, there were pocked of very strong demand from competing farm operations as well areas of decreased demand due to overly dry conditions. Southern Alberta was impacted in 2017 by a lack of rainfall on dryland, however this was offset by the pockets of increased demand. The Southern Alberta region’s irrigated land saw a stead to increase demand combined with limited supply leading to higher overall increase of 11.4%.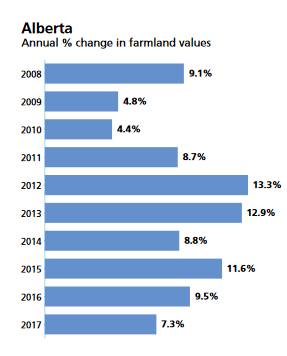
Real Estate update December 2017
Residential sales activity reported through the MLS® Systems of real estate boards in Alberta numbered 4,465 units in October 2017, down 1.3% from a year earlier. It was also slightly below the 10-year average for the month. On a year-to-date basis, home sales totaled 50,004 units over the first 10 months of the year, up 8.5% from the same period in 2016. Nationally, home sales activity was down 4.3% from year-ago levels in October 2017. The provincial average price for homes sold in October 2017 was $395,429, edging up 1% from a year earlier. The year-to-date average price figure was $400,301, up 1.5% from the first ten months of 2016.The national average price, by comparison, rose 5% on a year-over-year basis to $505,937 in October 2017. Across Alberta, monthly residential average prices were up from year-ago levels in South Central Alberta (+8.3%), Medicine Hat (+4.9%), The Edmonton board (+4.9%), Central Alberta (-2.9%), Calgary (+3.3%) and Alberta West (-0.19%). Meanwhile, average prices declined in Lloydminster AB (-2.2%), Lethbridge (-4.4%), Grande Prairie (-11.6%) and Fort McMurray (-14.7%).
New listings on the MLS® Systems of real estate boards in Alberta numbered 8,484 units in October, rising 10.8% from a year earlier. This was the highest level for the month in nine years. Active residential listings numbered 30,466 units at the end of October, up 12.6% from one year earlier. This was the highest level for the month in nine years. There were 6.8 months of inventory at the end of October 2017, up from six months at the same time one year ago and above the long-run average for this time of year. The number of months of inventory is the number of months it would take to sell current inventories at the current rate of sales activity.
The value of all home sales in the province totaled $1.76 billion in October 2017, edging down 0.4% from October 2016. The dollar volume of all home sales in Canada edged up 0.4% on a year-over-year basis. Sales of all property types in Alberta numbered 4,708 units in October, down 3.6% from October 2016. The value of those sales amounted to $1.9 billion, a decrease of 3.4% from a year earlier. A total of 1,845 home sales were recorded through the MLS® System of the Calgary Real Estate Board in October, down 10.3% from a year earlier. The combined value of home sales activity in Calgary was $850.4 million, 8.2% below year-ago levels. There were 1,589 home sales recorded through the MLS® System of the REALTORS® Association of Edmonton, up 8.6% from October 2016. The total value of home sales in Edmonton was $596.6 million in October 2017, up 14% on a year-over-year basis.